
So a good conversation with Napier’s visualisation expert and I’m now more aware of some of the ways to make my code more bombproof – too be implemented this weekend, if paper-writing and having a life allow.
Meanwhile I’ve completed colouring the LA boundaries. Here’s some pretty pictures:
Neither LAs nor CCs switched on

CCs switched on

LAs switched on
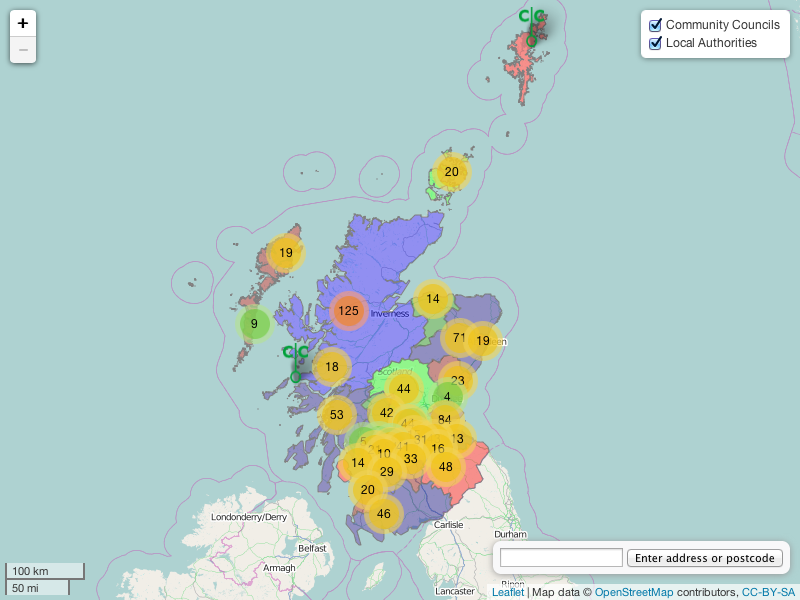
both switched on
I’m not too bothered that this uses 6 colours when there should be a four-colour solution. I’d be more picky about the actual colours used. Changing the colours is easy – just changing up to 6 values in a function in my main script. Changing which LAs each colour is applied to involves opening the huge geoJSON file full of LA data, then finding, say, East Ayrshire, then changing the value of colour_code immediately below it.
