Lynn Sharp of the Improvement Service has audited current Community Council online presences, finding their websites, Facebook presences and Twitter accounts. Before I say anything else, huge thanks to Lynn for collecting and supplying this data. I know how long and painful this task is. I’ve done it twice (in 2012 and 2014), and both times I came very close to throwing my computer and myself out of the window. Also, Lynn has found far more CC Twitter accounts than I or Peter had.
Lynn’s data does not investigate the quality of the internet presences, e.g. how frequently each is updated, when each was last updated, what sorts of content are present, although she did note that a few presences are over a year out of date. This would have added hugely to her task.
I took the liberty of doing some numerical analysis of this 2015 dataset. It’s quite rough-and-ready, partly because I was doing this in between other things that might be labelled ‘having a life’ but mostly because I’m no statistician.
Comparison with 2014 CC numbers
Lynn’s findings show 5 fewer CCs in Dundee than in the Napier 2012 and 2014 reports because in those works we also included Dundee’s neighbourhood representative bodies. (According to Dundee’s CCLO these are treated as if they are CCs.) There is one new CC in Highland (Inverness Central), two new CCs in Scottish Borders (Lammermuir; Upper Liddesdale and Hermitage) and two new CCs in West Lothian (‘Whitburn and Greenrig’ has split into ‘Whitburn’ and ‘Greenrig’). Hence in 2015 there is one fewer CC overall: 1368, instead of 2014’s total of 1369.
Initial analysis
Table 1 shows whether CCs have a website only, a Facebook presence only, a Twitter presence only, or specific combinations of these forms of online presence. Table 2 shows whether CCs have websites (they may also have Facebook or Twitter presences), Facebook presences (they may also have websites or Twitter presences), or Twitter presences (they may also have websites or Facebook presences).
773 of the current 1368 CCs (57%) have some form of internet presence. In 2014, 655 out of 1369 CCs (48%) were online some way. Overall, there are 118 more CC internet presences than in 2014. Long may this trend continue!
387 CCs (28%) have only a website, 115 CCs (8%) use only Facebook and 3 CCs (less than 1%) use only Twitter. 209 (15%) use two of these channels and 59 (4%) use all three. 130 (10%) use only social media, i.e. Facebook only, Twitter only or both Facebook and Twitter.
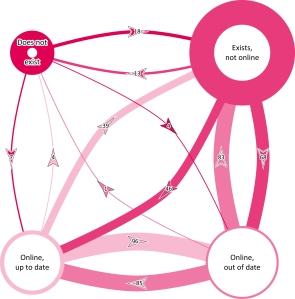
A future post will consider which CCs in 2014 and 2015 use each channel, i.e. how much churn there is. In 2014 we found there had been a lot.
(Click the graphic to see a full-sized PDF.)
LA ‘performances’
I’m quite concerned that people should equal access to services wherever they may be, especially within a country or nation. So I was interested in whether there are discrepancies between the data for CCs within each LA. There are indeed – some examples are shown in Table 3. Clackmannanshire, East Renfrewshire, Edinburgh and Inverclyde have the highest levels of internet use by these measures, while Dumfries and Galloway, Dundee, Eilean Siar, Midlothian, Orkney, Shetland, South Ayrshire, South Lanarkshire and West Dunbartonshire appear to have extremely low internet use.
In 2014, the low-scoring LAs were Dundee, East Dunbartonshire, Eilean Siar, Orkney, West Dunbartonshire and West Lothian. (See Figure 8 in the 2014 report. It would be interested to investigate demographic similarities and differences between the ‘consistently’ low-scoring LAs (shown in bold type in this paragraph).
What does it mean?
The bottom line is that 43% of CCs either do not exist or have no internet presence. Either way, there is a serious lack of digital engagement in Scotland’s hyperlocal democracy. Lynn’s data does not say how many CCs do not exist but, at very recent elections, 4 of Angus’s 25 potential CCs do not exist. If that proportion occurred all over Scotland, 219 CCs would not exist. (In 2014, 211 CCs did not exist.)
The LAs whose CCs did not use the internet well are little changed. It’s not clear whether the overall quality of internet use has changed, although some presences are seriously out of date. I can conclude that there is still a long way to go before CCs are properly using the internet to fulfil their duty to ‘ascertain, co- ordinate and express … the views of the communities which they represent’.
Table 1: CC internet use (2015) – numbers and %ages
| LA | no of CCs | Online | Web-site only | Facebook only |
Twitter only |
Website |
Website & |
Facebook & |
Website, |
||||||||
| N | % | N | % | N | % | N | % | N | % | N | % | N | % | N | % | ||
| Aberdeen | 30 | 18 | 60% | 8 | 27% | 1 | 3% | 0 | 0% | 5 | 17% | 1 | 3% | 0 | 0% | 3 | 10% |
| Aberdeen-shire | 70 | 51 | 73% | 32 | 46% | 5 | 7% | 1 | 1% | 7 | 10% | 1 | 1% | 0 | 0% | 5 | 7% |
| Angus | 25 | 17 | 68% | 9 | 36% | 4 | 16% | 0 | 0% | 3 | 12% | 1 | 4% | 0 | 0% | 0 | 0% |
| Argyll and Bute | 56 | 41 | 73% | 22 | 39% | 3 | 5% | 0 | 0% | 14 | 25% | 1 | 2% | 1 | 2% | 0 | 0% |
| Clackman-nanshire | 9 | 9 | 100% | 3 | 33% | 0 | 0% | 0 | 0% | 4 | 44% | 0 | 0% | 0 | 0% | 2 | 22% |
| Dumfries and Galloway | 107 | 51 | 48% | 30 | 28% | 8 | 7% | 0 | 0% | 13 | 12% | 0 | 0% | 0 | 0% | 0 | 0% |
| Dundee | 14 | 3 | 21% | 1 | 7% | 1 | 7% | 0 | 0% | 0 | 0% | 0 | 0% | 0 | 0% | 1 | 7% |
| East Ayrshire | 35 | 13 | 37% | 3 | 9% | 2 | 6% | 0 | 0% | 7 | 20% | 1 | 3% | 0 | 0% | 0 | 0% |
| East Dunbarton-shire | 13 | 9 | 69% | 4 | 31% | 0 | 0% | 0 | 0% | 3 | 23% | 1 | 8% | 0 | 0% | 1 | 8% |
| East Lothian | 20 | 14 | 70% | 6 | 30% | 2 | 10% | 0 | 0% | 2 | 10% | 2 | 10% | 0 | 0% | 2 | 10% |
| East Renfrew-shire | 10 | 8 | 80% | 0 | 0% | 2 | 20% | 0 | 0% | 4 | 40% | 0 | 0% | 0 | 0% | 2 | 20% |
| Edinburgh | 46 | 40 | 87% | 8 | 17% | 0 | 0% | 0 | 0% | 10 | 22% | 11 | 24% | 1 | 2% | 10 | 22% |
| Eilean Siar | 30 | 9 | 30% | 6 | 20% | 2 | 7% | 0 | 0% | 1 | 3% | 0 | 0% | 0 | 0% | 0 | 0% |
| Falkirk | 23 | 8 | 35% | 0 | 0% | 1 | 4% | 0 | 0% | 3 | 13% | 1 | 4% | 1 | 4% | 2 | 9% |
| Fife | 105 | 69 | 66% | 39 | 37% | 17 | 16% | 0 | 0% | 6 | 6% | 0 | 0% | 5 | 5% | 2 | 2% |
| Glasgow | 101 | 56 | 55% | 24 | 24% | 10 | 10% | 0 | 0% | 8 | 8% | 6 | 6% | 0 | 0% | 8 | 8% |
| Highland | 157 | 102 | 65% | 59 | 38% | 12 | 8% | 0 | 0% | 22 | 14% | 4 | 3% | 1 | 1% | 4 | 3% |
| Inverclyde | 11 | 7 | 64% | 1 | 9% | 1 | 9% | 0 | 0% | 0 | 0% | 0 | 0% | 1 | 9% | 4 | 36% |
| Midlothian | 16 | 15 | 94% | 13 | 81% | 2 | 13% | 0 | 0% | 0 | 0% | 0 | 0% | 0 | 0% | 0 | 0% |
| Moray | 20 | 10 | 50% | 5 | 25% | 4 | 20% | 0 | 0% | 0 | 0% | 0 | 0% | 1 | 5% | 0 | 0% |
| North Ayrshire | 17 | 7 | 41% | 2 | 12% | 1 | 6% | 0 | 0% | 3 | 18% | 0 | 0% | 1 | 6% | 0 | 0% |
| North Lanarkshire | 80 | 22 | 28% | 6 | 8% | 8 | 10% | 1 | 1% | 5 | 6% | 0 | 0% | 0 | 0% | 2 | 3% |
| Orkney | 20 | 6 | 30% | 4 | 20% | 1 | 5% | 1 | 5% | 0 | 0% | 0 | 0% | 0 | 0% | 0 | 0% |
| Perth and Kinross | 52 | 34 | 65% | 20 | 38% | 3 | 6% | 0 | 0% | 7 | 13% | 2 | 4% | 0 | 0% | 2 | 4% |
| Renfrew-shire | 26 | 16 | 62% | 8 | 31% | 5 | 19% | 0 | 0% | 2 | 8% | 1 | 4% | 0 | 0% | 0 | 0% |
| Scottish Borders | 69 | 45 | 65% | 25 | 36% | 3 | 4% | 0 | 0% | 12 | 17% | 3 | 4% | 0 | 0% | 2 | 3% |
| Shetland | 18 | 8 | 44% | 0 | 0% | 6 | 33% | 0 | 0% | 1 | 6% | 0 | 0% | 0 | 0% | 1 | 6% |
| South Ayrshire | 29 | 16 | 55% | 10 | 34% | 0 | 0% | 0 | 0% | 6 | 21% | 0 | 0% | 0 | 0% | 0 | 0% |
| South Lanarkshire | 58 | 23 | 40% | 14 | 24% | 4 | 7% | 0 | 0% | 5 | 9% | 0 | 0% | 0 | 0% | 0 | 0% |
| Stirling | 43 | 22 | 51% | 11 | 26% | 3 | 7% | 0 | 0% | 1 | 2% | 2 | 5% | 0 | 0% | 5 | 12% |
| West Dunbarton-shire | 17 | 6 | 35% | 3 | 18% | 1 | 6% | 0 | 0% | 2 | 12% | 0 | 0% | 0 | 0% | 0 | 0% |
| West Lothian | 41 | 18 | 44% | 11 | 27% | 3 | 7% | 0 | 0% | 1 | 2% | 2 | 5% | 0 | 0% | 1 | 2% |
| Totals | 1,368 | 773 | 57% | 387 | 28% | 115 | 8% | 3 | 0% | 157 | 11% | 40 | 3% | 12 | 1% | 59 | 4% |
Table 2: CCs that have websites, Facebook presences and Twitter feeds (2015)
| LA | no of CCs | website | |||||
| N | % | N | % | N | % | ||
| Aberdeen | 30 | 17 | 57% | 9 | 30% | 4 | 13% |
| Aberdeenshire | 70 | 45 | 64% | 17 | 24% | 7 | 10% |
| Angus | 25 | 13 | 52% | 7 | 28% | 1 | 4% |
| Argyll and Bute | 56 | 37 | 66% | 18 | 32% | 2 | 4% |
| Clackmannanshire | 9 | 9 | 100% | 6 | 67% | 2 | 22% |
| Dumfries and Galloway | 107 | 43 | 40% | 21 | 20% | 0 | 0% |
| Dundee | 14 | 2 | 14% | 2 | 14% | 1 | 7% |
| East Ayrshire | 35 | 11 | 31% | 9 | 26% | 1 | 3% |
| East Dunbartonshire | 13 | 9 | 69% | 4 | 31% | 2 | 15% |
| East Lothian | 20 | 12 | 60% | 6 | 30% | 4 | 20% |
| East Renfrewshire | 10 | 6 | 60% | 8 | 80% | 2 | 20% |
| Edinburgh | 46 | 39 | 85% | 21 | 46% | 22 | 48% |
| Eilean Siar | 30 | 7 | 23% | 3 | 10% | 0 | 0% |
| Falkirk | 23 | 6 | 26% | 7 | 30% | 4 | 17% |
| Fife | 105 | 47 | 45% | 30 | 29% | 7 | 7% |
| Glasgow | 101 | 46 | 46% | 26 | 26% | 14 | 14% |
| Highland | 157 | 89 | 57% | 39 | 25% | 9 | 6% |
| Inverclyde | 11 | 5 | 45% | 6 | 55% | 5 | 45% |
| Midlothian | 16 | 13 | 81% | 2 | 13% | 0 | 0% |
| Moray | 20 | 5 | 25% | 5 | 25% | 1 | 5% |
| North Ayrshire | 17 | 5 | 29% | 5 | 29% | 1 | 6% |
| North Lanarkshire | 80 | 13 | 16% | 15 | 19% | 3 | 4% |
| Orkney | 20 | 4 | 20% | 1 | 5% | 1 | 5% |
| Perth and Kinross | 52 | 31 | 60% | 12 | 23% | 4 | 8% |
| Renfrewshire | 26 | 11 | 42% | 7 | 27% | 1 | 4% |
| Scottish Borders | 69 | 42 | 61% | 17 | 25% | 5 | 7% |
| Shetlands | 18 | 2 | 11% | 8 | 44% | 1 | 6% |
| South Ayrshire | 29 | 16 | 55% | 6 | 21% | 0 | 0% |
| South Lanarkshire | 58 | 19 | 33% | 9 | 16% | 0 | 0% |
| Stirling | 43 | 19 | 44% | 9 | 21% | 7 | 16% |
| West Dunbartonshire | 17 | 5 | 29% | 3 | 18% | 0 | 0% |
| West Lothian | 41 | 15 | 37% | 5 | 12% | 3 | 7% |
| Totals | 1,368 | 643 | 47% | 343 | 25% | 114 | 8% |
Table 3: Selected results for LAs
| Measure | % of CCs online | CCs that have websites | CCs that have Facebook presences | CCs that have Twitter accounts | CCs that use all three forms of online presence |
| ‘best’ | Clackmannanshire
all 9 of its CCs are online in some way |
Clackmannanshire
all 9 of its CCs have websites |
East Renfrewshire
8 of its 10 CCs = 80% have Facebook pages |
Edinburgh
22 of its 46 CCs = 48% have Twitter accounts |
Inverclyde
4 of its 11 CCs = 36% use all three |
| ‘worst’ | Dundee
3 of its 14 CCs (21%) of its CCs are online |
Shetland
2 of its 18 CCs = 11% have websites |
Orkney
1 of its 20 CCs = 5% has a Facebook page |
Dumfries and Galloway, Eilean Siar, Midlothian, South Ayrshire, South Lanarkshire, West Dunbartonshire
(None of their CCs have Twitter accounts) |
Angus, Argyll and Bute, Dumfries and Galloway, East Ayrshire, Eilean Siar, Midlothian, Moray, North Ayrshire, Orkney, Renfrewshire, South Ayrshire, South Lanarkshire, West Dunbartonshire (None of their CCs use all three) |
| All-Scotland results | 773 of 1368 = 57% | 643 of 1368 = 47% | 343 of 1368 = 25% | 114 of 1368 = 8% | 59 out of 1368 = 4% |
