Flocking hell
Reply

Most of these days were spent rewriting a paper that will be presented at CeDEM, the international conference on e-democracy and open government. Now I’m back to finding the outer limits of each LA, in preparation for maybe implementing things about individual LAs on my map.
I’m taking part in a digital democracy panel discussion, hosted by the Commission on Strengthening Local Democracy.
Community council location-finder: the subject of most posts on this blog so far
Emergent ICT strategies for local democracy: capturing innovation: updating the survey of CC websites we did in 2012. What has changed? What are the patterns? What are the reasons underlying the patterns?
So no project work today – instead meeting up with spinning folk to finalise details for our trip to Bolzano next month. Because some folk will be off road-cycling before we spin, I thought it might be worthwhile everyone having everyone else’s cellphone numbers. The trip is being organised though FaceBook. It’s a worthwhile tool but there’s no way I’m giving it such contact details. So I suggested I set up a secure website on my domestic web-server, an old mac laptop.
So I dragged out the code from my web-design module and copied it across, intending to hack it down to a simple DB where people could enter names and numbers and view previously entered details, then set about ensuring PHP and MySQL were running. Not much work to find and install the latest versions of PHP and MySQL that will run under MacOS 10·4. Tiny bit of work (remembering how to use nano) to hack the apache config file to enable PHP. Even found GUI tools for MySQL. All fine and funky – except the mysql_connect command fails at the first fence. I know it’s deprecated, so I try mysqlreal_connect. This version of MySQL is too old to understand that command. Over and out!
And of course the simple solution, suggested by the lead spinnerette, is that she knows everyone’s cellphone numbers and can just email them around…
HUBRIS in large lumps.
So a good conversation with Napier’s visualisation expert and I’m now more aware of some of the ways to make my code more bombproof – too be implemented this weekend, if paper-writing and having a life allow.
Meanwhile I’ve completed colouring the LA boundaries. Here’s some pretty pictures:
Neither LAs nor CCs switched on

CCs switched on

LAs switched on
both switched on
I’m not too bothered that this uses 6 colours when there should be a four-colour solution. I’d be more picky about the actual colours used. Changing the colours is easy – just changing up to 6 values in a function in my main script. Changing which LAs each colour is applied to involves opening the huge geoJSON file full of LA data, then finding, say, East Ayrshire, then changing the value of colour_code immediately below it.
Manually copying and pasting 32 sets of bits of file is fraught with difficulty, as any fule kno. So there had to be an easier way to assemble the individual LA geoJSON files into one javascript file. I did a lot of comparison of the brackets and guts of the working-so-far leaflet example and my geoJSON files. My file began with
{
“type”: “FeatureCollection”,
“crs”: { “type”: “name”, “properties”: { “name”: “urn:ogc:def:crs:OGC:1.3:CRS84” } },
We only want one FeatureCollection, with 32 features for the 32 LA boundaries. So in a new laBoundaryData.js file, containing var laBoundaryData = { }; from the first LA file insert
“type”: “FeatureCollection”,
“crs”: {
“type”: “name”,
“properties”: {
“name”: “urn:ogc:def:crs:OGC:1.3:CRS84” } },
“features”: [{
“type”: “Feature”,
“properties”: {
“NAME”: “Aberdeen City”,
“AREA_CODE”: “UTA”,
“DESCRIPTIO”: “Unitary Authority”,
“FILE_NAME”: “ABERDEEN_CITY”,
“NUMBER”: 7.0,
“NUMBER0”: 34.0,
“POLYGON_ID”: 122136.0,
“UNIT_ID”: 30421.0,
“CODE”: “S12000033”,
“HECTARES”: 20561.013,
“AREA”: 1990.394,
“TYPE_CODE”: “AA”,
“DESCRIPT0”: “CIVIL ADMINISTRATION AREA”,
“TYPE_COD0”: null,
“DESCRIPT1”: null,
“colour_code”:2 //BMR 2014_02_21
},
“geometry”: {
“type”: “MultiPolygon”,
“coordinates”: [ [ [ [ -2.360870189456887, 57.10919031061777 ….]]]] } },
Note the comma. After it, paste { “type”: “Feature”, “properties”: ….]]]] } } from the next LA file, then add a comma. Then rinse and repeat.
Far from elegant but much easier than isolating wee bits from each file.
I spent a while today trying to drop a marker at the user’s entered location. It’s easy to do on(zoomed) add marker but removing it at the next zoom is so far beyond me. Back to fighting with LA borders – the theatre of battle being styling them
I knew from leaflet’s example that leaflet does style geoJSON – so the issue must have been with my geoJSON files. When in doubt, copy: I copied leaflets’ code for colouring US state geoJSON data, substituted in the Scottish LA names and a piece to colour them by code rather than population density, and lo and behold it works.
Truth – it took a while to isolate the co-ordinate lines, so I’m only a wee way into substituting in the LA co-ordinates. But here’s the proof:

With thanks to Leaflet.js forum members Matt and Simon.
I was encouraged to try again to obtain up-to-date LA boundary data from the OS. This time I obtained a set of shape files. The relevant shape file was district_borough_unitary_region.shx. I opened that in QGIS, removed the non-Scottish areas and saved the result as Scotland.qgs. I then selected and saved each LA in turn as a geoJSON vector file (with CRS = WGS84/EPSG4326 as before). So this got me up-to-date accurate LA boundaries. But these are quite large files: averaging 2MB each. (Of course Highland was much bigger than Clackmannashire, for example.)
To obtain simplified files, I selected each LA in turn, then did Vector > Geoprocessing tools > Simplify (options: ‘use only selected features’, tolerance = 50, ‘save to new file’, ‘add to canvas’) so that I had a patchwork of separate LAs:
 I then selected each simplified LA in turn and saved them as geoJSON files. The resulting files are about a twentieth of the size of the unsimplified files. Yet zooming right in shows an acceptable (to me) fit to the unsimplified boundaries and coastlines. Yeehah.
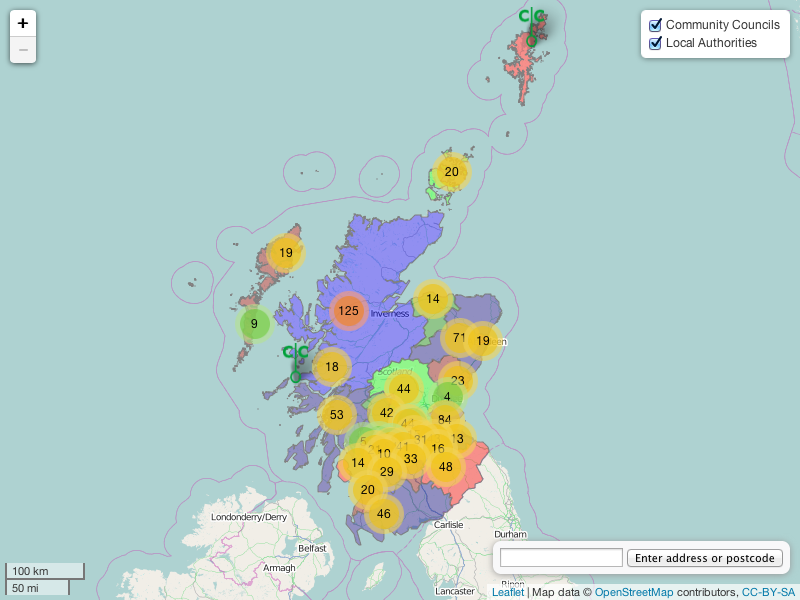
We have layers
 And now the LA group is off by default, while the locater and layer controls are expanded by default:

Remember the problem with geocoding? It may just be fixed.
My main script has a function to set the bounds of the displayed map. If you try to drag the map so that areas outside these bounds are displayed, the map will snap back to the area I want it to display.
I had a look through the geocoder script – it has an options object, one line of which sets bounds to null. So I made this line call the setScotlandBounds function from my main script. After a bit of futzing to understand how one script can call a function in another script (the secret is to make the web page call them in the right order!), it works. EH10 5DT is where it should be. Searching for London gets London in Orkney.
I am so relieved – hacking the geocoder script or playing with Nominatim looked fearsome.
Next step is to hack geocoder or my main script so it doesn’t zoom in ridiculously. And that’s quite simple – just set a maxZoom in the map options object.
And the final MUST do – adding a pin at the user’s entered location sort of works. Because the map will definitely zoom when displaying the desired location, adding an onzoom event to put a marker works. But if you zoom in again, another marker will be placed.
The solution to that will be to place the marker into a layer. The next zoom would remove that layer.
More actual CC website (i.e. not work) stuff this morning, then back to litRev.
Looked at to-do list – I’ve not tested the postcode to latlong batch converter (http://www.doogal.co.uk/BatchGeocoding.php). Doing so just now with updated DumGal postcodes.
Looks OK visually:

but not exact match with inherited data (lats average 1.14% off, longs average 0.53% off).
I think that’s close enough because we don’t want to be too accurate!
