2014_02_11: to do list

Peter: CC location finder
Edit Bruce’s draft IIDI item, then tweet it IN PROGRESS RIGHT NOW
Sort permissions on cngn.co.uk (MAY NOT BE NECESSARY – the webserver bit works)
Bruce: CC location finder
Retweet PAC’s tweet
Get task trackers up to date. DO THIS EVERY DAY! DONE
Update MoSCoW list for CC location finder (include bounds to pan/scroll and search) DONE
Refactor code using array for list of LAs (not 32 repeated lumps of code)
Next most important task: limiting pan/scroll and search
White background for site
Find a way of batchconverting postcodes to LatLong
Testrun it on 2011 data
Bruce: CeDEM and CC website survey
Draft tasklist for CeDEM paper revisions. Concentrate on stuff that would help survey project
Bruce: funding
Implement PAC thoughts (does Aims bit include appropriate words, dewhiteman text)
Get Hazel advice on language
Get Hakanpaa, Nina N.Hakanpaa@napier.ac.uk advice on costs
Bruce: Commission on Strengthening Local Democracy
Respond I will make it, PAC would like to come but has teaching commitments
Set date with Peter for discussion of what we might say
Advertisement

2014_02_09

So I’ve given up on the polygons for now. In fact, I’ve received some advice in response to an online plea for LatLong shape files for Scottish LAs but I won’t be able to look into this until Tuesday afternoon.

So today on with the show of drawing a map with markers for all CCs for which I have LatLong data. This should have been easy – I’d had something very like this working for 2 CCs already, with different coloured markers for whether the CC had both website and email address, just an email address, no electronic contact details or no actual functionality.

I started by knocking up some css and a disclaimer/copyright page and some custom markers for functional and non-functional CCs – easy, if not the prettiest thing ever. Then I followed the recipe for displaying a couple of LAs’ CCs (without differentiating between functional and non-functional), with the markers for each LA coalescing when zooming out from the map.

All fine, until I noticed the numbers in the coalescences were not correct – there should have been 19 CCs in Aberdeen and 71 in Aberdeenshire, but while Aberdeen was correct, Aberdeenshire had 90 CCs, so the markers for Aberdeen were presumable adding to the Aberdeenshire set.

I then added in Angus CCs, and got even more confusing numbers. I battled with this for several hours, even stripping the code right down to for each CC in the whole dataset, document.write(“rude word”); No joy.

So this is where my personal life affects my work life – I went to my regular sunday evening spin class. I started again about 8:30 and within 30 minutes, I had it properly working numbers for 3 CCs. 29 fairly tedious additions to a case statement and checks that the right numbers appeared, all 32 LAs’ CCs were appearing correctly.

A quick hack to one LA got me green marked for functional CCs and red marked for non-functional ones, with each LAs’ own CCs coalescing into one lump no matter what colour they were.

Then half an hour’s web-trawling got each LA’s CCs’ markers displaying popups linking to the relevant LA web pages. Job done!

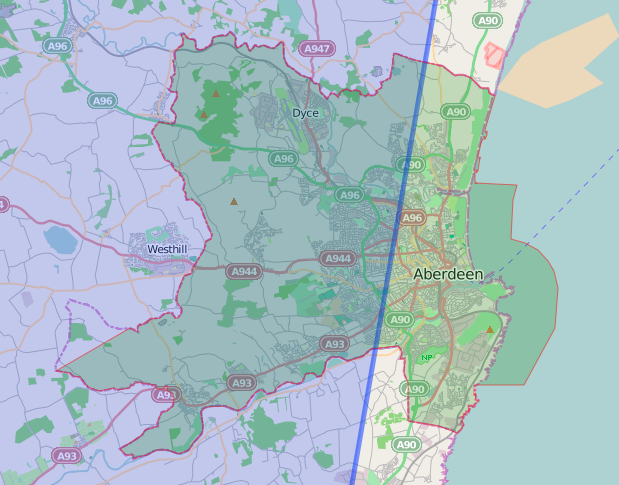
So entry to the page draws a map of Scotland, with all CCs for which we have LatLong data coalesced into lumps that show the number of CCs in each coalescence. Zooming in, or clicking on a coalescence de-coalescesces so that markers for individual CCs display. A marker is green if the CC is functional and red if it isn’t. Each marker has a popup with the name of the CC and a link to the relevant LA’s webpages about its CCs. Entering a postcode or address in the search box zooms to that place, so you can see the CCs around it. (You may need to zoom out a little.) We will draw a discrete veil over the question of how good the LatLong data I’m currently working with is – not my problem!

Still to do

  • display LA boundaries
  • get the search box to drop a marker
  • optionally, calculate the distance to the nearest CC
  • optionally, calculate the distance to the nearest functional CC
  • be able to switch on and off each LA’s markers, using leaflet.js’s layers functionality
  • optionally, to calculate distances to the nearest (functional) CC in an LA if only one is switched one
  • write a hacker-guide
  • style links in <h1>s

Getting there!

2014_02_06 encore

I couldn’t leave it alone this evening – 5 hours after I got home and I’ve done the 6 LAs on Scotland’s mid-east coast. The wee bit that was missing from Aberdeen has been restored. (I processed that dataset again and the missing points magically reappeared. So here it is in glorious technicolour:

Screen Shot 2014-02-07 at 04.46.30

The points are very close to the LA boundaries on OpenStreetMap tiles, which is quite encouraging. The dashed line is OpenStreetMap and the solid line is Leaflet’s rendering of the converted data.

Screen Shot 2014-02-07 at 04.46.12

Fife is a 4-part multipolygon, that is there are four polygons in the bits that represent Fife. I guess these are the Isle of May, Inchkeith and Inchcolm. Each part of a multi polygon requires separate processing via the hero of the hour(s), http://gridreferencefinder.com/batchConvert/batchConvert.php.

So I’m dreading doing Shetland, Orkney and the Western Isles. But perhaps they don’t need to be marked or coloured because they are clearly separate from the mainland.

Less heroic have been Mac TextEdit (no RegEx), TextMate (one successful RegEx, then fell over and won’t stop trying to process a long finished-with Angus file) and Word (it has done most of the heavy kiting but has fallen over at least 10 times). I’ll forgive Eclipse for chugging away with RegExes very slowly but I won’t forgive it for completing the RegEx then hanging so I can’t save the result.

The optimal process seems to be

  1. Open the original data file in Word.
  2. Find any sub-polygons, by replacing  ] ], [ [ with multiple <new line>s.
  3. Save.
  4. Grep ], [ with ,<new line>
  5. Save.
  6. Get rid of the dross at the start and end of the of the file, so that I’m left with just sets of [number,number],<new line>[number,number], …[number,number],<new line>[number,number].
  7. Save.
  8. Manually copy and paste the first set into the heroic web page, and tell it to convert. If it moans, there is more than one set in what I’ve copied, so go back and sort it out. At this point, Word will fall over – hence the multiple saves,
  9. When a clean data set is in the hero, it will convert the data to lines containing some unwanted blurb and the data in LatLong format.
  10. Copy that bit to a new TextEdit file called <LA-name>.js, then leave some spaces.
  11. Convert the next data set, i.e the next polygon in the multipolygon.
  12. Copy and paste that data into the TextEdit file.
  13. Repeat steps 8-12 until all polygons are in the TextEdit file. Save and close it.
  14. Open it in Eclipse. Do the RegEx to remove the unwanted blurb. (To play it safe, do a few hundred lines at a time, saving each time.
  15. Save and close the file – Eclipse is about to fall over.
  16. Open the file in Word again, then replace all multiple new lines with a suitable swearword.
  17. Replace all new lines with ], [
  18. Replace the swearwords with ], [
  19. Top and tail the file so that it has the format var <LAname>  = [ [ [number, number], … [number, number] ],  [ [number, number], … [number, number] ], …  [ [number, number], … [number, number] ] ]; 
  20. Save it in the right place in the website data structure, add the necessary call to index.html’s head and the necessary Leaflet call to drawMap.js.
  21. Open the web page and draw the map.
  22. Fix the colours in drawMap.js
  23. Move on to the next LA!

2014_02_06

  1. got UK local authority data from https://www.sharegeo.ac.uk/handle/10672/305
  2. converted .shx file to .js using ogr2ogr -f “GEOJSON” newfilename.js sourcefilename.shx
  3. open resulting 88MB file in Word – around 10,000 pages.
  4. Find first mention of Scotland – it’s about 7000 pages in. It’s to do with Angus.
  5. Find second mention of Scotland. This is in the code marking the start of the data for Clackmannanshire.
  6. Select all the data for Angus, then cut it out and paste it to a new document. Save that as Angus.txt.
  7. Repeat steps 4 to 6 to get data files for all 32 Scottish LAs.
  8. Such a shame they are in National Grid format, not lat/long.
  9. proj4leaflet claims to handle other projections. Trying it but the huge size of the clackmannashire data file seems to be killing Eclipse. So have abandoned that, going back to what we have so far and trying to convert NG co-ords to latlong.
  10. http://gridreferencefinder.com/batchConvert/batchConvert.php batch converts but there’s a lot of Word/RegEx jiggery pokery to prepare the stuff for batch-conversion, then convert the results to array format.
  11. It almost works for Aberdeen, but a few data-points seem to be missing.Screen Shot 2014-02-06 at 19.00.04Screen Shot 2014-02-06 at 18.57.41
  12.  (Ignore the blue line and shading in the first screenshot – it’s part of a very rough outline of the UK, from when I was trying to get to grips with geoJSON use in Leaflet.Screen Shot 2014-02-06 at 19.01.54
  13. The conversion step is choking my mac, so time to ask the internet if anyone has LatLong shapefiles for the Scottish LAs.
  14. Here endeth today’s lesson.