2014_03_04 progress re LA colours, calculating LA extrema and switching off unwanted polygons for markerClusterGroups

We’re into March! After meeting with the client, a few changes are needed.

Colouration

Working from the chloropleth example, I’ve chosen 5 colours (cyan = #0080ff, red = #ff0000′, yellow = #ffff00, blue = #0000ff’ and green = #00ff00). This choice was inspired by Education Scotland’s map.)

In the geoJSON file, each feature (i.e. each LA) has an extra line in the ‘properties’ piece: “colour_code”:3 //BMR 2014_02_21.

The code to decide colours is
function getLAcolour(d) {
  return d == 1  ? ‘#0080ff’:
            d == 2  ? ‘#ff0000’:
           d == 3  ? ‘#ffff00’:
           d == 4  ? ‘#0000ff’:
           ‘#00ff00’;
} // end getLAcolour()

Then there’s a function to create a style object:
function laStyle(feature) {
    return {
        fillColor: getLAcolour(feature.properties.colour_code),
       weight: 2,
       opacity: 1,
       color: ‘white’,
       dashArray: ‘3’,
       fillOpacity: 0.7,
       fillOpacity: 0.4
   };
} //end laStyle(feature)

Then the geoJSON function does the heavy lifting:
L.geoJson(laBoundaryData, {style: laStyle}).addTo(laLayerGroup);
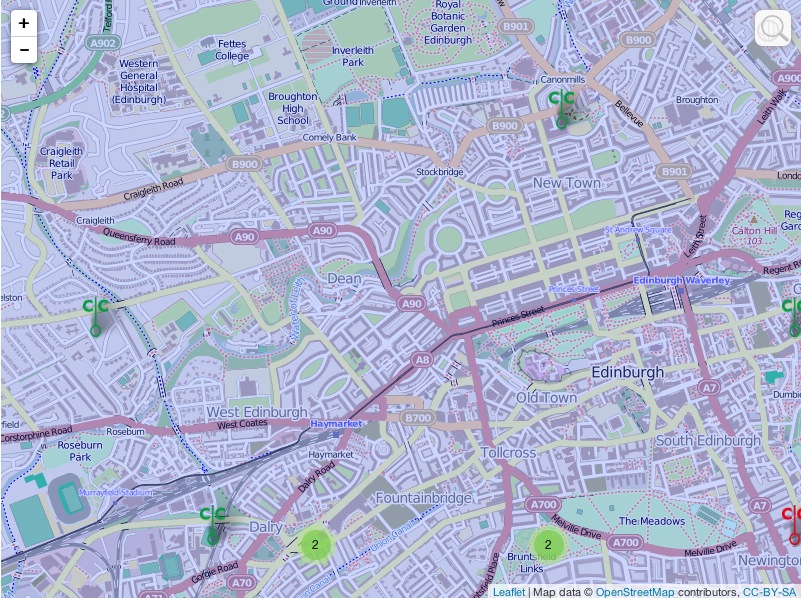
So the whole effect looks like this:Screen Shot 2014-03-04 at 16.28.40It’s deliberately similar in look to this map of constituencies and MSP activities:Screen Shot 2014-03-04 at 16.29.32
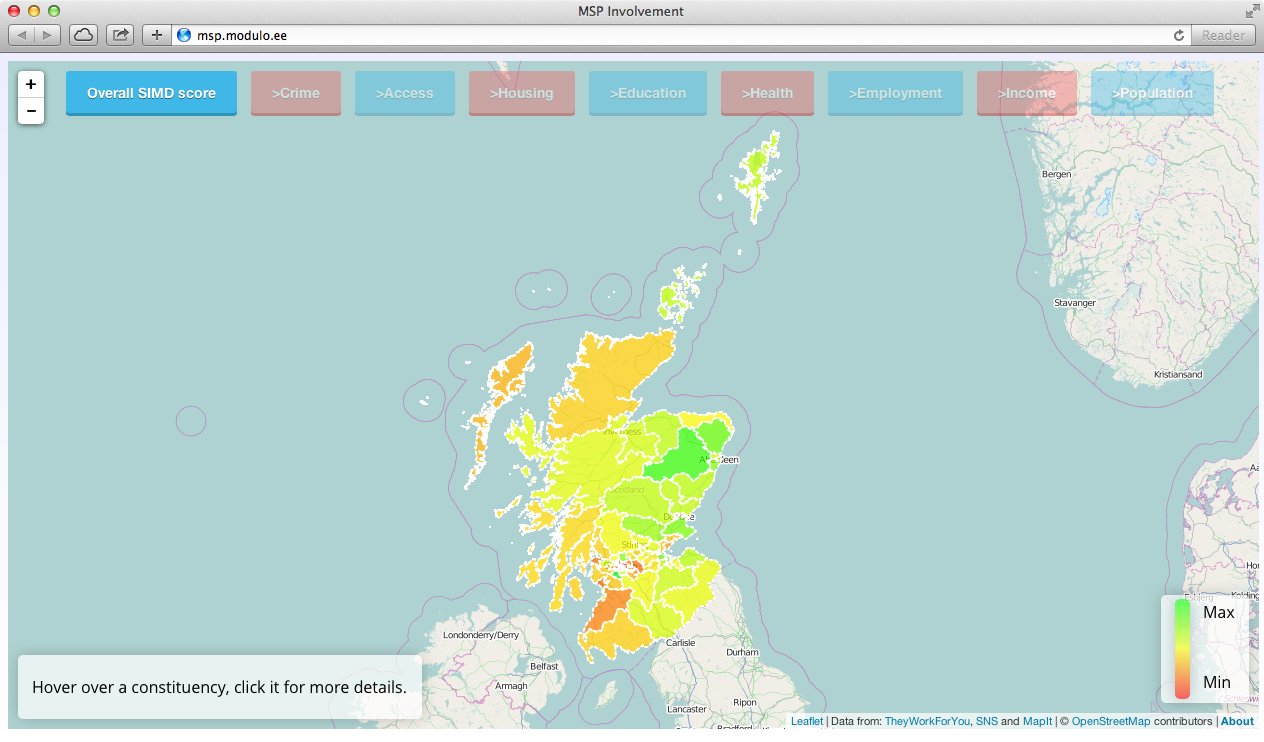
I’ve also moved the link to © data and acknowledgements to a second line in the acks piece at the bottom of the map, so far less screen area is taken up by non-map things. The instructions will go onto a pop-out pane access from a big ? on an edge of the map. Currently they clutter things:Screen Shot 2014-03-04 at 16.34.14

Calculating LA boundaries and extrema: how I did it

I do not claim this was the most efficient way! The following is an expanded write-up of a previous blog entry.

  1. Obtain up to date shape files from the Ordnance Survey (BoundaryLine is the relevant product.)
  2. Start a new project in QGIS.
  3. Do Layer > Add vector layer and select district_borough_unitary region.
  4. Make the layer editable.
  5. Select and cut out the non-Scottish features.
  6. Save the project as Scotland.
  7. Select each LA in turn, then do Vector > Geometry tools > Simplify geometries. The options I used were:Screen Shot 2014-03-04 at 17.07.58 but with a different file for each LA. For example, Shetland’s 160,883 vertices were reduced to 5416.
  8. Select the newly-created object, then do Layer > Save selection as vector file, with optionsScreen Shot 2014-03-04 at 17.09.30

So now I had 32 separate geoJSON files. To combine them, I used the process described here to make a single laBoundaryData.js file. That’s my geoJSON file on which the above styling magic works.

Finding LA extrema

In future versions of this map, I’ll want to zoom into individual LAs. The easy way to do this will be (I think) to find the furthest north, south, east, west points of each LA. So I adapted my code to find Scotland’s extrema to work on each LA:
function drawMap() {
    //BMR 2014_02_25
    //find extreme points
    var north = 0;
    var south = 90;
    var west = 90;
    var east = -90;
 
    for (var i = 0; i < coordinates.length; i++) {
        var laDatum = coordinates[i];
        // the other way round from the getScotlandBounds because geoJSON latlongs are in the opposite order to leaflet latlogns
        var longitude = laDatum[0];
        var latitude = laDatum[1];

        if (latitude > north) {
            north = latitude;
        //end if

        if (latitude < south) {
            south = latitude;
        //end if

        if (longitude < west) {
            west = longitude;
        //end if

        if (longitude > east) {
            east = longitude;
        //end if
    //end for

    document.write(“north = ” + north + “, south = ” + south + “, west = ” + west + “, east = ” + east);

}// end drawMap

It’s a complete hack but I copied, pasted and edited the results into my laData.js file to get line such as
    [“Angus”, “http://www.angus.gov.uk/commcouncil&#8221;, 
        56.986816427679120, 56.46164866362316, -3.407021822671358, -2.420365421269425],

If I’d been clever, I’d have made the script write the extrema data to the file. But this is a one-off and so it would have taken longer to write code to do it than to do it myself.

Switching off unwanted polygons for markerClusterGroups

Awe and respect to the leaflet programming folk. I feared I might need to dig into their actual code to switch off these unwanted polygons. But it’s as simple as adding an option object to the otherwise unoptioned code. That is, from this

L.markerClusterGroup();

to this

L.markerClusterGroup({showCoverageOnHover: false});

Advertisement

2014_02_16: progress

So after ac couple of days of literature reviewing, and spending Saturday being social, I was back at the code-face today.

Task 1: understand – and maybe cure – the failing geocoder

Entering single-initial letter postcodes such as EH3 7PX works – the map zooms to the right place. Entering textual places such as Merchiston, Leith Links, Macmerry and Dalry also works. But EH10 5DT still appears to be in Walthamstow, instead of Merchiston. EH12 6AP appears to be slightly east of Walthamstow, instead of near Murrayfield.

I noticed that EH10 5DT and E10 5DT both give the same place (in east London), as do EH12 6AP and E12 6AP. So Nominatim is omitting the H in some cases. Interestingly, the geocoder works with Macmerry’s postcode (EH33 1PL).

To see whether it was my fault, I created a stripped-down version from scratch: the javascript contains just the map declaration, the code to fill it with tiles and the geocoder. Same result – so it’s the geocoder, not my code. I feel far less guilty but I’ll need to fix this.

Task 2: understand how leaflet.js handles geoJSON files

I worked my way through http://leafletjs.com/examples/geojson.html. I got most of it to work, except for styling the output. I then got a trial LA boundary to work – this trial had 4 co-ordinates. If it will work for four, it will work for many, many more – but will take longer.

Task 3: make geoJSON files of LA boundaries

With thanks to a Leaflet mailing list member for some sage advice, I’ve installed QGIS. This could open the 18-month old UK local authorities file I obtained from https://www.sharegeo.ac.uk/handle/10672/305. (It couldn’t handle the .sld files I obtained from the Ordnance Survey.) The way I worked – there may well be better ways – was to select an LA, then do Layer > Save selection as a vector file with options

  • format = geoJSON
  • CRS =  WGS84/EPSG4326

It took a while to work out the correct CRS option. I was surprised it wasn’t WGS84/PseudoMercator/EPSG3857 because that appears to be Leaflet’s default CRD. Then again, what do I know about converting points on am irregular 3D surface to points on a flat plane?

Anyway, that gave me 32 nice geoJSON files in a little less than 2 hours.

Task 4: display LA boundaries

Using my stripped-down version of the code, I added in 32 routines to display the LA boundaries. They were still in the default blue – remember I’d not cracked styling them. There may be an advantage to separate routines and data files. If an LA ever changes, I’d just need to make new geoJSON files for that LA and its neighbours, and each can be coloured (if this ever works!) separately. Anyway, by adding var = <LA_name> [ to the beginning of each file and ]; to the end of each, then appropriately commenting off all routines except for the LA I was testing, I made sure each displayed OK.

I then tried a few methods to programatically assemble the files into one huge array of the form var laBoundaryData = [ [content of first geojson file], [content of second geojson file], ….[content of last geojson file] ];  Another hour down the pan and no joy, so I did it the hard way, copying and pasting the contents of the geoJSON files into
var laBoundaryData = [
],
[
], 
[
]
];

It almost worked straight off – all the LAs apart from Shetland and Scottish Borders displayed as they should. Shetland and Scottish Borders had some weird horizontal lines, but removing them from the huge file, then replacing their code from their individual geoJSON files got rid of these nasty artefacts. I guess I had pasted the code in slightly the wrong place first time round.

Then the code for displaying the LAs is just a simple traversal of the array of LA boundary data. And all this without going anywhere near the command line.

So with my map displaying all LA boundaries, it was time for…

Task 5: putting it all back together

I’d thought this would be easy – just replace the code lumps for calculating the map centre, its bounds and displaying the CCs. Not a bit of it! Failure points included not calling the data, scripts and even the css in the right order, the functions for calculating centres and bounds not being called properly – aarrgh. Anyway after a couple of hours, it’s all there. It’s slow (I guess need to simplify the LA shapes before writing them to geoJSON format), the geocoder is still a mystery but it works. Yeehah!

The initial result

The initial result

zoomed into the West End of Edinburgh - see the markers for individual CCs

zoomed into the West End of Edinburgh – see the markers for individual CCs


My reward for all that – 2 more hours doing stuff to a real CC’s website!


2014_02_08

Just started processing Shetland shape file. There are 549 polygons. There are 201,158 co-ordinates. Updated process:

  1. Prepare a Word text file called Shetland.js which contains only var shetland = [ ];
  2. In a copy of the file containing the data for Shetland, replace all ] ], [ [ with two <new line> in Word. Save.
  3. In the same file, replace all ], [ with <new line> in Word. Save.
  4. Get rid of dross at beginning and end of file. Save. You now have just co-ordinates, with a double <new line> between the set for each island.
  5. Find first double <new line>.
  6. Cut all co-ordinates preceding this. Save – you don’t want to risk doing this set twice.
  7. Paste the clipboard into the online batch converter, then convert.
  8. Copy the converted data into TextMate. Save.
  9. Do the first RegEx to get rid of the dross from the conversion step. Save.
  10. Do the second RegEx to replace all <new line>s with ], [, then save.
  11. Add , [ [ to the beginning of the Textmate file, and ] ] at the end. Save.
  12. Copy the whole of the TextMate file and paste it into shetland.js just before ]; (For the first set, you don’t need the initial comma.) Save.
  13. Refresh the map webpage – another island will have been highlighted.

2014_02_06 encore

I couldn’t leave it alone this evening – 5 hours after I got home and I’ve done the 6 LAs on Scotland’s mid-east coast. The wee bit that was missing from Aberdeen has been restored. (I processed that dataset again and the missing points magically reappeared. So here it is in glorious technicolour:

Screen Shot 2014-02-07 at 04.46.30

The points are very close to the LA boundaries on OpenStreetMap tiles, which is quite encouraging. The dashed line is OpenStreetMap and the solid line is Leaflet’s rendering of the converted data.

Screen Shot 2014-02-07 at 04.46.12

Fife is a 4-part multipolygon, that is there are four polygons in the bits that represent Fife. I guess these are the Isle of May, Inchkeith and Inchcolm. Each part of a multi polygon requires separate processing via the hero of the hour(s), http://gridreferencefinder.com/batchConvert/batchConvert.php.

So I’m dreading doing Shetland, Orkney and the Western Isles. But perhaps they don’t need to be marked or coloured because they are clearly separate from the mainland.

Less heroic have been Mac TextEdit (no RegEx), TextMate (one successful RegEx, then fell over and won’t stop trying to process a long finished-with Angus file) and Word (it has done most of the heavy kiting but has fallen over at least 10 times). I’ll forgive Eclipse for chugging away with RegExes very slowly but I won’t forgive it for completing the RegEx then hanging so I can’t save the result.

The optimal process seems to be

  1. Open the original data file in Word.
  2. Find any sub-polygons, by replacing  ] ], [ [ with multiple <new line>s.
  3. Save.
  4. Grep ], [ with ,<new line>
  5. Save.
  6. Get rid of the dross at the start and end of the of the file, so that I’m left with just sets of [number,number],<new line>[number,number], …[number,number],<new line>[number,number].
  7. Save.
  8. Manually copy and paste the first set into the heroic web page, and tell it to convert. If it moans, there is more than one set in what I’ve copied, so go back and sort it out. At this point, Word will fall over – hence the multiple saves,
  9. When a clean data set is in the hero, it will convert the data to lines containing some unwanted blurb and the data in LatLong format.
  10. Copy that bit to a new TextEdit file called <LA-name>.js, then leave some spaces.
  11. Convert the next data set, i.e the next polygon in the multipolygon.
  12. Copy and paste that data into the TextEdit file.
  13. Repeat steps 8-12 until all polygons are in the TextEdit file. Save and close it.
  14. Open it in Eclipse. Do the RegEx to remove the unwanted blurb. (To play it safe, do a few hundred lines at a time, saving each time.
  15. Save and close the file – Eclipse is about to fall over.
  16. Open the file in Word again, then replace all multiple new lines with a suitable swearword.
  17. Replace all new lines with ], [
  18. Replace the swearwords with ], [
  19. Top and tail the file so that it has the format var <LAname>  = [ [ [number, number], … [number, number] ],  [ [number, number], … [number, number] ], …  [ [number, number], … [number, number] ] ]; 
  20. Save it in the right place in the website data structure, add the necessary call to index.html’s head and the necessary Leaflet call to drawMap.js.
  21. Open the web page and draw the map.
  22. Fix the colours in drawMap.js
  23. Move on to the next LA!

2014_02_05 Progress

I can’t remember much of last week. My diary tells me I was occupied every weekday evening. Monday, Wednesday and Thursday evenings were at gyms, with a brief visit to a social media surgery before Thursday evening’s gym session. Tuesday and Friday evenings were spent helping a community council set up its new WordPress blog.

I know I spent Thursday and Friday creating management tools for the two community council projects. This also took up some of Monday (3rd). Tuesday saw a very brief planning meeting, then I jumped on a train to Glasgow to meet the ever-delightful Heather Burns, then go to Ofcom’s Digital Participation round table, then come back from Glasgow to help the CC with its website again. (There isn’t any real problem with it – it’s a standard WordPress.com website but linked to a .co.uk domain. I haven’t yet set up email addresses using the domain – I suspect that might be a headache.)

Today I’ve sent data to the visualisation client so they can verify it. (The data is from 2011-12 and so is out of date – the client’s contacts should clean it up so the project’s website accurately portrays where things are.)

The latest version of the code shows I can display a polygon based on a geoJSON file (tutorial).

Screen Shot 2014-02-05 at 18.22.07

I also know I can obtain open shapefiles for LAs from the Ordnance Survey. The intervening step is to convert shapefiles to geoJon. Supposedly GDAL does that but I’ve not yet persuaded my mac to run it. Following this tutorial may help – but that’s for tomorrow!

Update

This tutorial shows how to actually use geoJSON files!