Global Challenges Research Fund: sector meeting 29 October 2019 #GCRF

The Global Challenges Research Fund (GCRF) ‘is a £1.5 billion fund announced by the UK Government in late 2015 to support cutting-edge research that addresses the challenges faced by developing countries’. Its delivery partners include the Scottish Funding Council (SFC). Earlier this year, I was commissioned by the SFC to produce a web-map of the GCRF projects it funds.

I was invited to present about the map at the SFC’s GCRF sector meeting at the sector meeting on 29 October.

Hence a major part of this post is to record what Isaid about the map. The other major part is slightly edited versions of my live-tweets from the meeting. The rest of the post is Bruce-thoughts tweeted at the time, in (round brackets), and Bruce-thoughts that occurred while writing this post, in [square brackets].

My work was very well received, so I am very happy to have boosted my reputation (and that of Edinburgh Napier University), with representatives of the other Scottish universities, and with a significant research-funder.

All photos and information reported below are © the presenters and their relevant colleagues. Click the images to see the full-size versions. Continue reading

Advertisement

Wise words and mega maps

Leah Lockhart, social media advisor and all-round good egg, has been blogging about fears and barriers in public services on LinkedIn. Here are her thoughts on fears people have about being abused online, fears around negotiating online identity, fears digital champions have about inertia generally but especially in hierarchical leadership and finally about fears around BYOD.

Thanks also to ‘Lelil’ for drawing me to Leah’s tale of how to use topical hashtags to draw extra traffic to community council Tweets.

Well worth a read for any CC member (or any other elected member or public servant) involved in digital engagement with their citizens, in my opinion.

Continue reading

My current work-themes – and my wishlist

Partly so I can get it clear in my own head, here are the themes I’m currently working on, and the other work I’d also like to do if I ever get the chance!

Continue reading

2014_03_11: it’s progress Jim, but not as we know it

So I spent most of yesterday trying to find what causes my work to crash Safari under iOS7: turns out it’s the gizmo that clusters the CC markers. Not going to cure that in a hurry!

Then I tried for several hours to add the info features from leaflet’s chloropleth/geoJSON example to my script. I got the LAs to highlight on mouseover, but not to de-highlight on mouseout. Nor could I get the data control to pick out data from the LA geoJSON file.

So I reasoned ‘if I can’t add their stuff to mine, can I add my stuff to theirs?’ That is, could I swap in my LA and CC data sets and use leaflet’s code to colour them and pick out data to be displayed in their external control? This seemed to go OK until I added in the geocoder (the bit for entering an address to zoom to that area of the map. This code failed, so everything that should have been processed after it wasn’t even reached.

I went back to trying to add leaflet’s functions to my otherwise functional code. Still no joy.

I refactored my code so it was in a more logical order:

  1. preparatory functions,
  2. drawing basic map
  3. adding scale, geocoder, reset and help controls to map
  4. adding LA data layer
  5. adding CC data layer
  6. adding layers on/off control

and made the reset control call a URL from a simple configuration file, so that when the client actually puts this work online, they only need to update the configuration file, not hack around in the reset script.

I still couldn’t get the mouseout bit to work. I knew this code was being called: if I replaced it with document.write(“rude word”); then rude words were written.

So this evening I revisited leaflet’s example, determined to get it to work. This example has all the functionality built into a script in the html file, not a separate ‘external’ script. Not really the way I want but I’m running out of time…

I realised that the geocoder was being called but just failing somewhere. I’m not sure how I worked it out but the fail point was that geocoder calls a function in my main external script to limit its searches to Scotland – the same bounds as are applied to my map. (Without this search-area limiting, searching for EH10 postcodes shows Walthamstow.) But this script is never invoked, so the function isn’t callable. So instead of calling that function, I’ve copied it into the geocoder. Now that works! And so do all the other bits. I can make the reset script call the configuration file, so long as they are in the right order in the html header (i.e. configuration before the reset function that depends on it – so perhaps the issue was that the geocoder was calling the main script before it was available.

There was another wrinkle adding in the CC marker code. Something doesn’t like a variable called location. Changing that to ccLocation worked.

So here is the whole lot working – but with the javascript embedded in the HTML.

My task for tomorrow is to get the javascript into a separate file, so that this works, cos right now it doesn’t. Then write some documentation, then write a talk for the OKFN meet-up tomorrow.

2014_03_10

Added reset button

It’s another hack down of the OSMGeocoder control, mostly because I don’t have time to understand how to create a control from scratch. The main fault with it is that it relies on

inner.innerHTML = “<a href=\”http://localhost:8888/realISV22\”><img src = \”css/images/reset.png\”></a>”;

The bold bit will need to be replaced with the real URL for wherever the site will be used.

News!

New news

I’m taking part in a digital democracy panel discussion, hosted by the Commission on Strengthening Local Democracy.

Old news 1

Community council location-finder: the subject of most posts on this blog so far

Old news 2

Emergent ICT strategies for local democracy: capturing innovation: updating the survey of CC websites we did in 2012. What has changed? What are the patterns? What are the reasons underlying the patterns?

2014_02_19: LA boundary progress

With thanks to Leaflet.js forum members Matt and Simon.

I was encouraged to try again to obtain up-to-date LA boundary data from the OS. This time I obtained a set of shape files. The relevant shape file was district_borough_unitary_region.shx. I opened that in QGIS, removed the non-Scottish areas and saved the result as Scotland.qgs. I then selected and saved each LA in turn as a geoJSON vector file (with CRS = WGS84/EPSG4326 as before). So this got me up-to-date accurate LA boundaries. But these are quite large files: averaging 2MB each. (Of course Highland was much bigger than Clackmannashire, for example.)

To obtain simplified files, I selected each LA in turn, then did Vector > Geoprocessing tools > Simplify (options: ‘use only selected features’, tolerance = 50, ‘save to new file’, ‘add to canvas’) so that I had a patchwork of separate LAs:

simplified LAsI then selected each simplified LA in turn and saved them as geoJSON files. The resulting files are about a twentieth of the size of the unsimplified files. Yet zooming right in shows an acceptable (to me) fit to the unsimplified boundaries and coastlines. Yeehah.

We have layers

Screen Shot 2014-02-19 at 14.53.03And now the LA group is off by default, while the locater and layer controls are expanded by default:

Screen Shot 2014-02-19 at 15.32.29


2014_02_16: progress

So after ac couple of days of literature reviewing, and spending Saturday being social, I was back at the code-face today.

Task 1: understand – and maybe cure – the failing geocoder

Entering single-initial letter postcodes such as EH3 7PX works – the map zooms to the right place. Entering textual places such as Merchiston, Leith Links, Macmerry and Dalry also works. But EH10 5DT still appears to be in Walthamstow, instead of Merchiston. EH12 6AP appears to be slightly east of Walthamstow, instead of near Murrayfield.

I noticed that EH10 5DT and E10 5DT both give the same place (in east London), as do EH12 6AP and E12 6AP. So Nominatim is omitting the H in some cases. Interestingly, the geocoder works with Macmerry’s postcode (EH33 1PL).

To see whether it was my fault, I created a stripped-down version from scratch: the javascript contains just the map declaration, the code to fill it with tiles and the geocoder. Same result – so it’s the geocoder, not my code. I feel far less guilty but I’ll need to fix this.

Task 2: understand how leaflet.js handles geoJSON files

I worked my way through http://leafletjs.com/examples/geojson.html. I got most of it to work, except for styling the output. I then got a trial LA boundary to work – this trial had 4 co-ordinates. If it will work for four, it will work for many, many more – but will take longer.

Task 3: make geoJSON files of LA boundaries

With thanks to a Leaflet mailing list member for some sage advice, I’ve installed QGIS. This could open the 18-month old UK local authorities file I obtained from https://www.sharegeo.ac.uk/handle/10672/305. (It couldn’t handle the .sld files I obtained from the Ordnance Survey.) The way I worked – there may well be better ways – was to select an LA, then do Layer > Save selection as a vector file with options

  • format = geoJSON
  • CRS =  WGS84/EPSG4326

It took a while to work out the correct CRS option. I was surprised it wasn’t WGS84/PseudoMercator/EPSG3857 because that appears to be Leaflet’s default CRD. Then again, what do I know about converting points on am irregular 3D surface to points on a flat plane?

Anyway, that gave me 32 nice geoJSON files in a little less than 2 hours.

Task 4: display LA boundaries

Using my stripped-down version of the code, I added in 32 routines to display the LA boundaries. They were still in the default blue – remember I’d not cracked styling them. There may be an advantage to separate routines and data files. If an LA ever changes, I’d just need to make new geoJSON files for that LA and its neighbours, and each can be coloured (if this ever works!) separately. Anyway, by adding var = <LA_name> [ to the beginning of each file and ]; to the end of each, then appropriately commenting off all routines except for the LA I was testing, I made sure each displayed OK.

I then tried a few methods to programatically assemble the files into one huge array of the form var laBoundaryData = [ [content of first geojson file], [content of second geojson file], ….[content of last geojson file] ];  Another hour down the pan and no joy, so I did it the hard way, copying and pasting the contents of the geoJSON files into
var laBoundaryData = [
],
[
], 
[
]
];

It almost worked straight off – all the LAs apart from Shetland and Scottish Borders displayed as they should. Shetland and Scottish Borders had some weird horizontal lines, but removing them from the huge file, then replacing their code from their individual geoJSON files got rid of these nasty artefacts. I guess I had pasted the code in slightly the wrong place first time round.

Then the code for displaying the LAs is just a simple traversal of the array of LA boundary data. And all this without going anywhere near the command line.

So with my map displaying all LA boundaries, it was time for…

Task 5: putting it all back together

I’d thought this would be easy – just replace the code lumps for calculating the map centre, its bounds and displaying the CCs. Not a bit of it! Failure points included not calling the data, scripts and even the css in the right order, the functions for calculating centres and bounds not being called properly – aarrgh. Anyway after a couple of hours, it’s all there. It’s slow (I guess need to simplify the LA shapes before writing them to geoJSON format), the geocoder is still a mystery but it works. Yeehah!
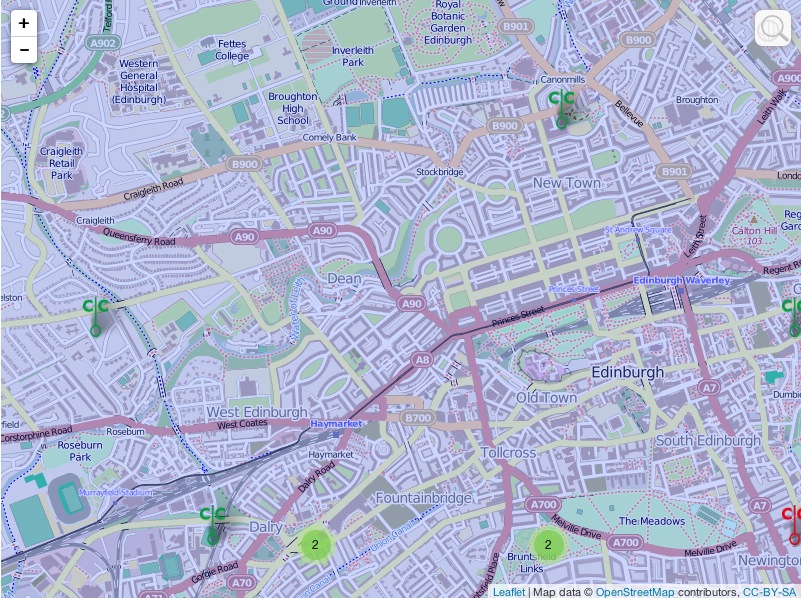
The initial result

The initial result

zoomed into the West End of Edinburgh - see the markers for individual CCs

zoomed into the West End of Edinburgh – see the markers for individual CCs


My reward for all that – 2 more hours doing stuff to a real CC’s website!


2014_02_09

So I’ve given up on the polygons for now. In fact, I’ve received some advice in response to an online plea for LatLong shape files for Scottish LAs but I won’t be able to look into this until Tuesday afternoon.

So today on with the show of drawing a map with markers for all CCs for which I have LatLong data. This should have been easy – I’d had something very like this working for 2 CCs already, with different coloured markers for whether the CC had both website and email address, just an email address, no electronic contact details or no actual functionality.

I started by knocking up some css and a disclaimer/copyright page and some custom markers for functional and non-functional CCs – easy, if not the prettiest thing ever. Then I followed the recipe for displaying a couple of LAs’ CCs (without differentiating between functional and non-functional), with the markers for each LA coalescing when zooming out from the map.

All fine, until I noticed the numbers in the coalescences were not correct – there should have been 19 CCs in Aberdeen and 71 in Aberdeenshire, but while Aberdeen was correct, Aberdeenshire had 90 CCs, so the markers for Aberdeen were presumable adding to the Aberdeenshire set.

I then added in Angus CCs, and got even more confusing numbers. I battled with this for several hours, even stripping the code right down to for each CC in the whole dataset, document.write(“rude word”); No joy.

So this is where my personal life affects my work life – I went to my regular sunday evening spin class. I started again about 8:30 and within 30 minutes, I had it properly working numbers for 3 CCs. 29 fairly tedious additions to a case statement and checks that the right numbers appeared, all 32 LAs’ CCs were appearing correctly.

A quick hack to one LA got me green marked for functional CCs and red marked for non-functional ones, with each LAs’ own CCs coalescing into one lump no matter what colour they were.

Then half an hour’s web-trawling got each LA’s CCs’ markers displaying popups linking to the relevant LA web pages. Job done!

So entry to the page draws a map of Scotland, with all CCs for which we have LatLong data coalesced into lumps that show the number of CCs in each coalescence. Zooming in, or clicking on a coalescence de-coalescesces so that markers for individual CCs display. A marker is green if the CC is functional and red if it isn’t. Each marker has a popup with the name of the CC and a link to the relevant LA’s webpages about its CCs. Entering a postcode or address in the search box zooms to that place, so you can see the CCs around it. (You may need to zoom out a little.) We will draw a discrete veil over the question of how good the LatLong data I’m currently working with is – not my problem!

Still to do

  • display LA boundaries
  • get the search box to drop a marker
  • optionally, calculate the distance to the nearest CC
  • optionally, calculate the distance to the nearest functional CC
  • be able to switch on and off each LA’s markers, using leaflet.js’s layers functionality
  • optionally, to calculate distances to the nearest (functional) CC in an LA if only one is switched one
  • write a hacker-guide
  • style links in <h1>s

Getting there!

2014_02_08

Just started processing Shetland shape file. There are 549 polygons. There are 201,158 co-ordinates. Updated process:

  1. Prepare a Word text file called Shetland.js which contains only var shetland = [ ];
  2. In a copy of the file containing the data for Shetland, replace all ] ], [ [ with two <new line> in Word. Save.
  3. In the same file, replace all ], [ with <new line> in Word. Save.
  4. Get rid of dross at beginning and end of file. Save. You now have just co-ordinates, with a double <new line> between the set for each island.
  5. Find first double <new line>.
  6. Cut all co-ordinates preceding this. Save – you don’t want to risk doing this set twice.
  7. Paste the clipboard into the online batch converter, then convert.
  8. Copy the converted data into TextMate. Save.
  9. Do the first RegEx to get rid of the dross from the conversion step. Save.
  10. Do the second RegEx to replace all <new line>s with ], [, then save.
  11. Add , [ [ to the beginning of the Textmate file, and ] ] at the end. Save.
  12. Copy the whole of the TextMate file and paste it into shetland.js just before ]; (For the first set, you don’t need the initial comma.) Save.
  13. Refresh the map webpage – another island will have been highlighted.